How to Use Google Lighthouse to Improve Performance (DevTools)
If you haven’t heard about it yet, let us change your Performance Testing world: Google Lighthouse is an open-source (free), easy-to-use tool to help you improve your website’s performance.
Using five key metrics, Google Lighthouse allows you to view and improve the overall quality of your webpages. You can expect to receive feedback on your website’s performance, SEO, accessibility, web apps, and a lot more.
Running it couldn’t be simpler: all you need to do is use Chrome DevTools with your Google Chrome browser. This set of web developer tools is already built into Google Chrome, so there is no need to install any additional software.
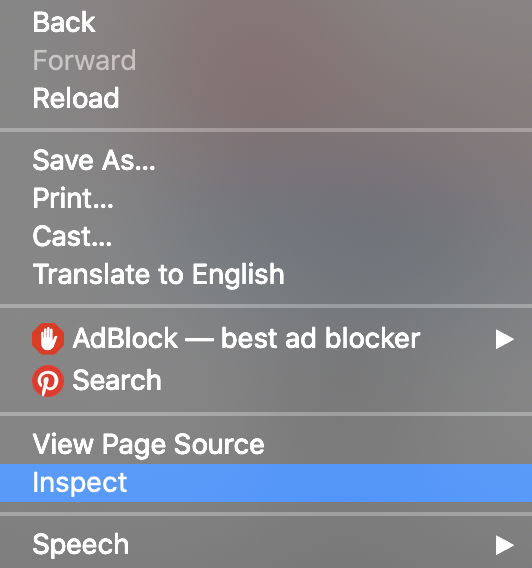
To start, right click anywhere on the page you want to test and select “Inspect.”
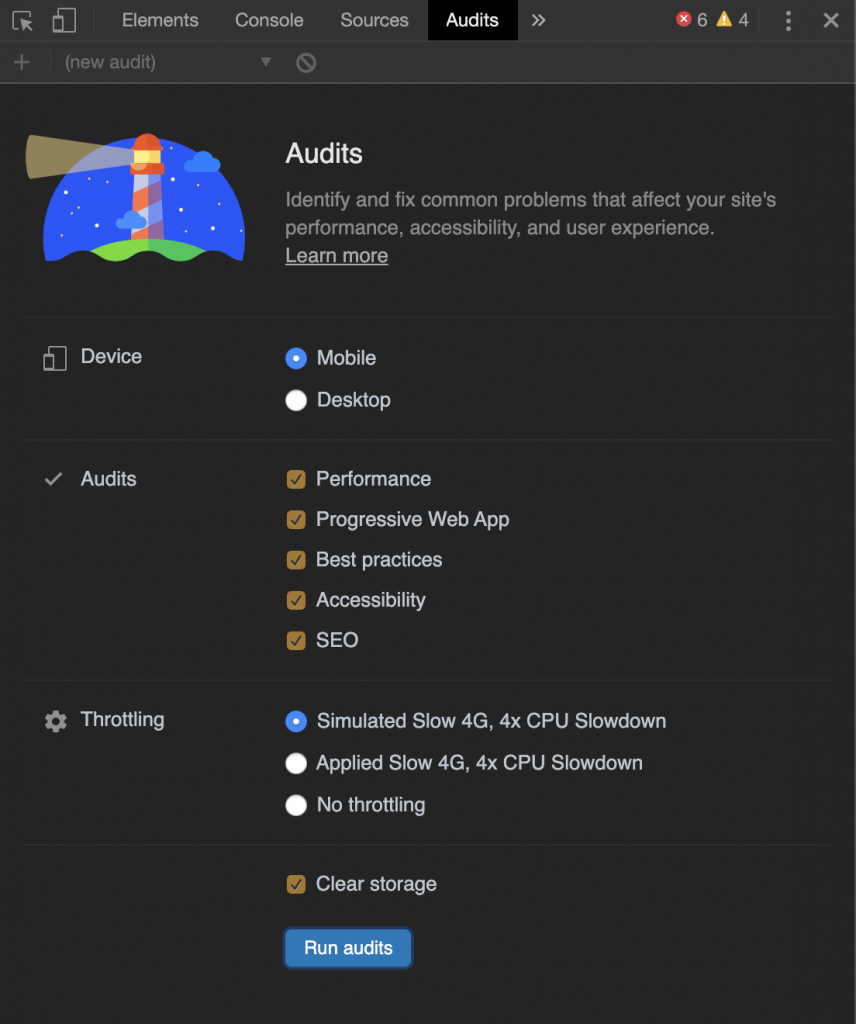
On the Audits tab, select the criteria you want to inspect, such as whether you’d like to test the Mobile or Desktop version, performance, accessibility, or SEO.

Finally, you’ll be able to check out the audit that Google Lighthouse created for you and explore which areas of your website you can improve.
This audit goes into considerable detail on each of the metrics, which can be very useful for you to outline the next steps in order to improve your performance.
On Google Chrome’s DevTools page they provide a video that showcases live demos of the tool’s processes. Essentially, what this tool does is run a series of tests on your page and tells you how your page performed on each of them. Any criteria that fails, or performs poorly, on these tests will be indicated to you on the report. This tool can be a very helpful resource for you to improve your business, as slow and unresponsive pages can lead to poor user experience and profit loss.
The Five Performance Metrics
Within this report you will find 5 different metrics, and we want to make sure you know exactly what each of them means so that you can apply them correctly. When you press on each of the metrics, you will get a detailed report about each one, with actionable tips.
*The images below are from a Google Lighthouse audit we ran on a random website
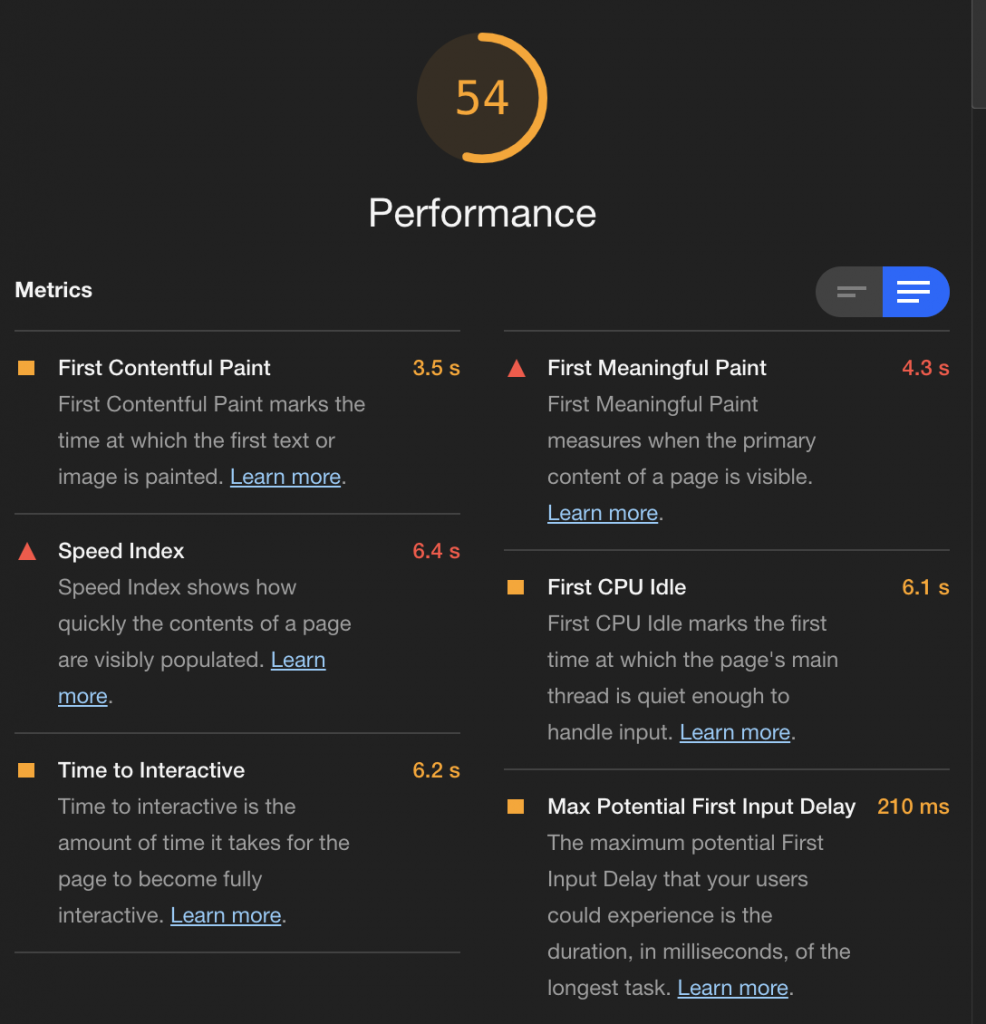
The Performance Score
The Performance score runs between 0 – 100, 0 being the lowest score. It will show you how long your content (including any images and videos) takes to load. It will also tell you how long it takes until your website becomes fully interactive. Typically, a score between 0-49 will leave you in the red (slow) zone, 50-89 means your webpage performs like average, and 90-100 means your webpage is fast!
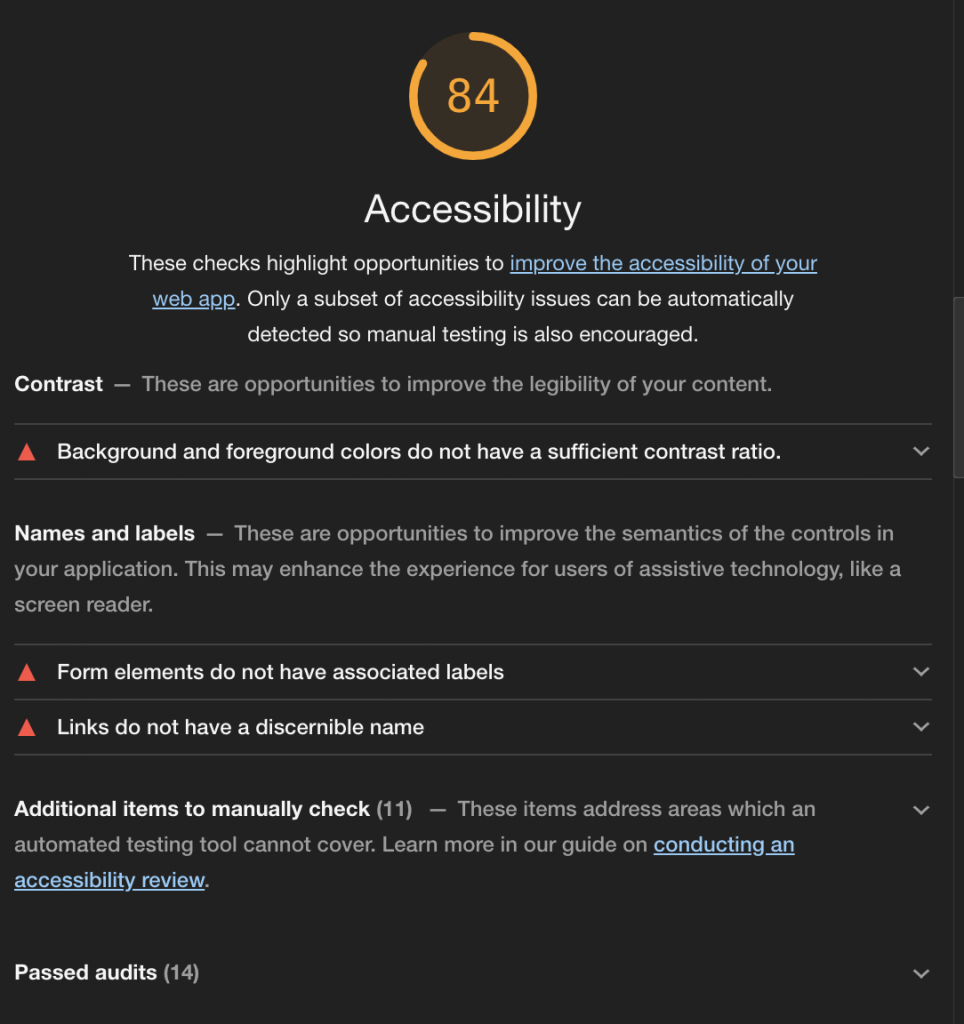
The Accessibility Score
Like the Performance Score, the Accessibility Score also runs on a scale from 0-100. Each test it runs in this section is based on a pass (100) or a fail (0) and the total result is an average of these scores. Here, you’ll be able to see things like whether background and foreground colors have sufficient contrast ratio, which elements are missing labels, amongst other related things.
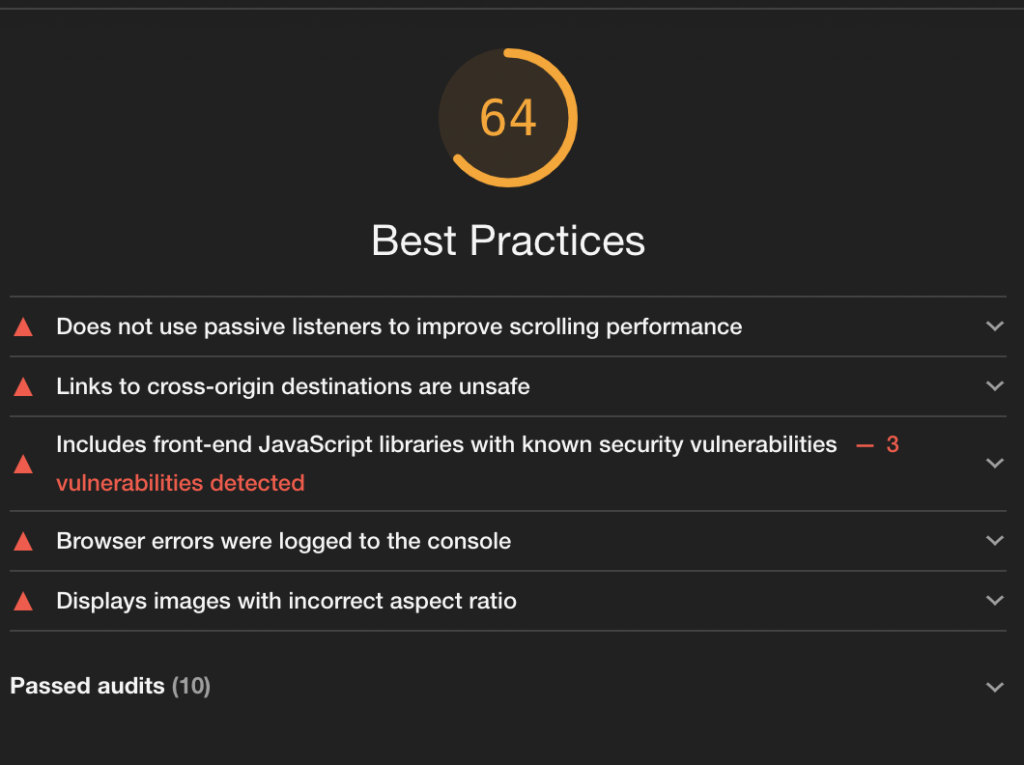
The Best Practices Score
Once again, this score also runs on a 0-100 scale. This audit measures, you guessed it, best practices; it will give you feedback on things like scrolling performance, browser errors, and display images aspect ratios.
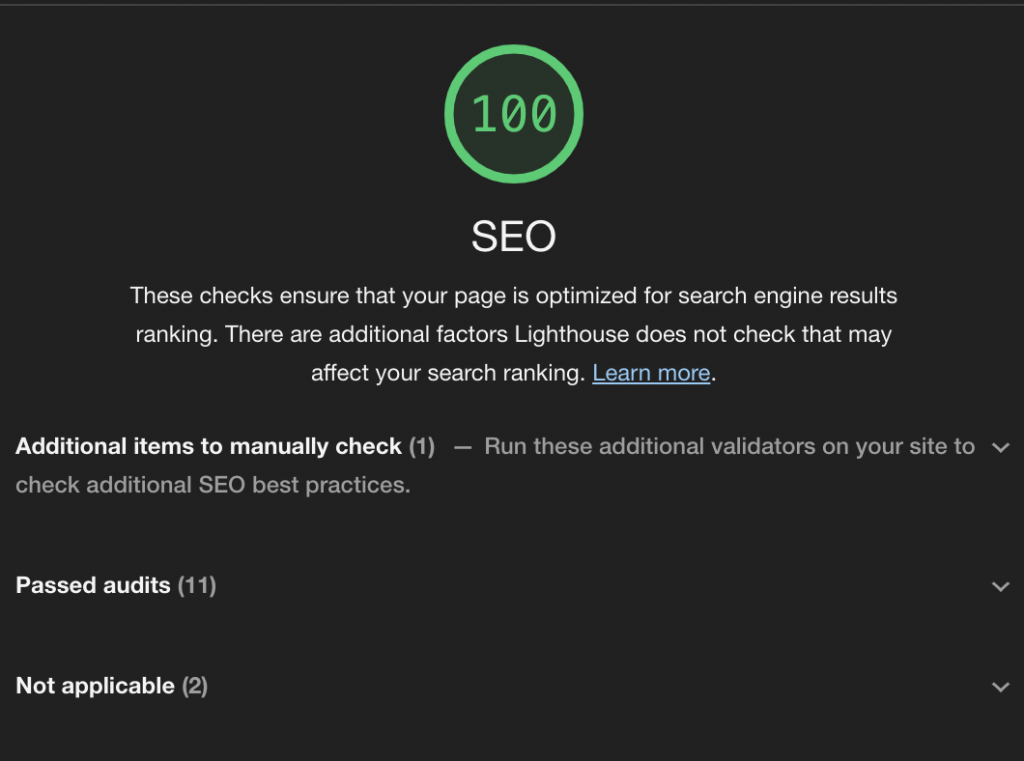
The SEO Score
The SEO score will indicate to you, on a score out of 100, how well your page is optimised for search engine results. This score will determine how well your page will do on rankings in search engines like Google. Things like adding the correct keywords to your text and Alt descriptions to your images can play a huge role in SEO. Free plugins like Yoast can help you with SEO directly from your backend (such as WordPress).
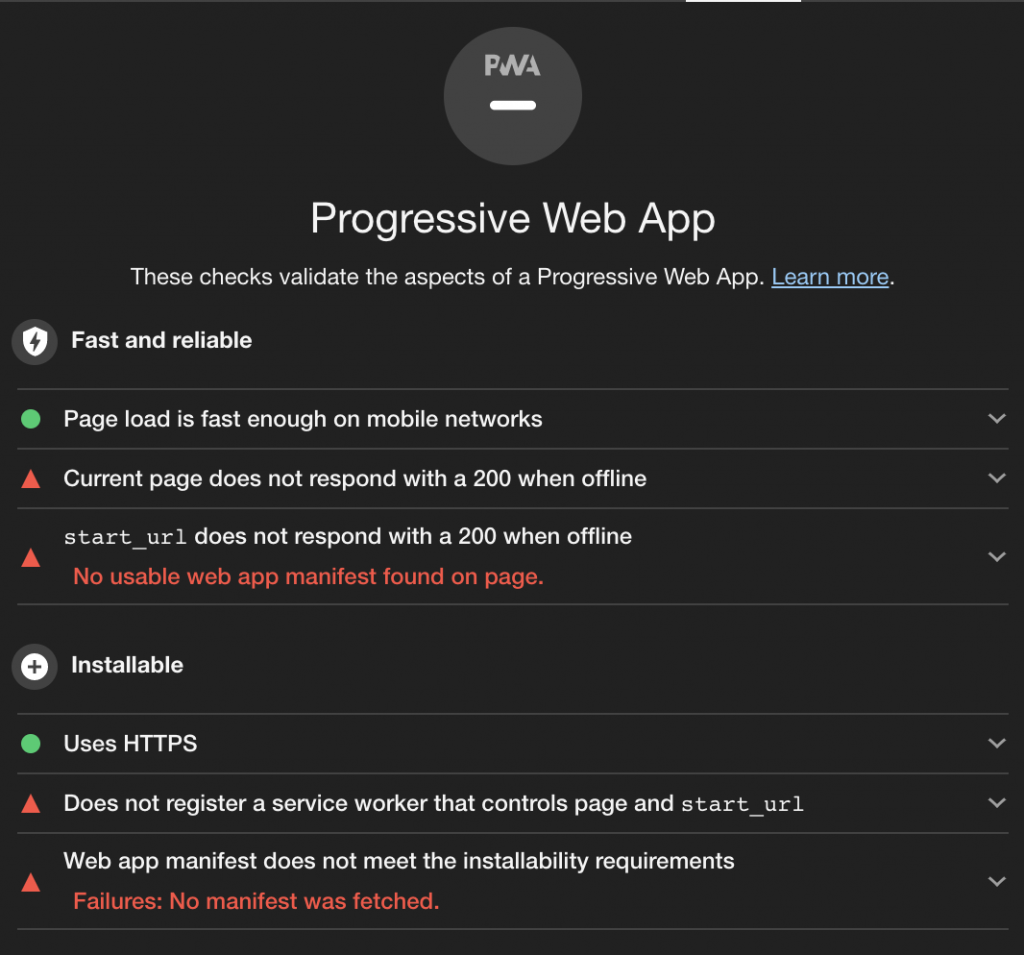
The Progressive Web App Score
Last but certainly not least, the Progressive Web App Score is (surprise, surprise) also based off of a 0 to 100 score. This one is based off of the Baseline PWA Checklist. It will tell you more about the page’s speed and reliability, HTTPS status, and many other things. Feel free to check out the link above for the full list.
We hope that this article helped you understand Google Lighthouse a little better, and happy performance testing!