How to test the performance of containers and microservices
Breaking a service level agreement is expensive (and stressful.) No one wants to compromise their web performance because a microservice was unable to keep up with user loads. Even if you tested early in the development process, maybe you were missing the resources to really tackle containers and microservices.
Total Performance Consulting (TPC) is here to take the load off. When it comes to containers and microservices, TPC is the expert at performing different load tests to:
- make them work on a bigger scale
- take care of them
- ensure you have impeccable distributed system performance
In this article, we’ll explore the benefits and techniques of performance testing containers and microservices with TPC. As well as popular tools used to address issues when scaling containers and microservices.
See how TPC can help you deliver an amazing user experience in distributed environments. Delivering a great user experience is a pivotal aspect of seasonal readiness. Read about all the moving parts that impact seasonal readiness in “Software Performance Engineering: Biggest Challenges (and Solutions) in 2023”.
More specifically, we’ll cover the following topics:
- What are containers
- What are microservices
- The difference between containers and microservices
- Challenges for scaling containers
- Challenges of scaling microservices
- Getting Started with TPC
What are containers
Containers are lightweight, efficient, and virtual compartments that hold everything an application needs to run smoothly. They ensure seamless movement of applications between different computing environments without any difficulties.
Imagine a container as a small, self-contained unit. It includes all the necessary files, libraries, and settings needed for an application to work correctly. The container provides isolation and security, keeping each application separate from others running on the same machine.
With containers, you can create, test, and deploy applications more efficiently, making the whole process smoother and more manageable.
What are microservices
Microservices are a modern architectural approach in software engineering. They involve dividing applications into small, independent, and loosely coupled services known as microservices.
Each microservice is responsible for a specific task or functionality, and they communicate with each other through well-defined interfaces. This architecture allows for greater flexibility, scalability, and resilience in software systems.
Microservices enable organizations to adopt a modular approach, allowing for the separate development, updating, and scaling of each service. This promotes faster development cycles and enhances overall system performance.
The difference between containers and microservices
Containers provide the runtime environment for microservices to run independently. Microservices are small modular services that work together, while containers package dependencies for consistent application execution across environments.
In other words, containers “contain” microservices, and help you manage, deploy, or extend those microservices.
Challenges for scaling containers
These are the main challenges when using containers at scale:
Complexity
Using containers in a distributed system is tough because you need to manage host and container-level metrics. In a traditional system, tuning host metrics like CPU, memory, threads, disk space, and network usage is already a challenging task. However, with containers, the complexity increases because you must now optimize container-specific metrics such as:
- CPU
- memory
- swap
- I/O
- network usage
A popular tool for managing container complexity is Prometheus. It works by regularly collecting metrics from different parts of the system, like containers, through a process called scraping. These metrics are then stored in a database so that they can be analyzed and used for monitoring purposes.
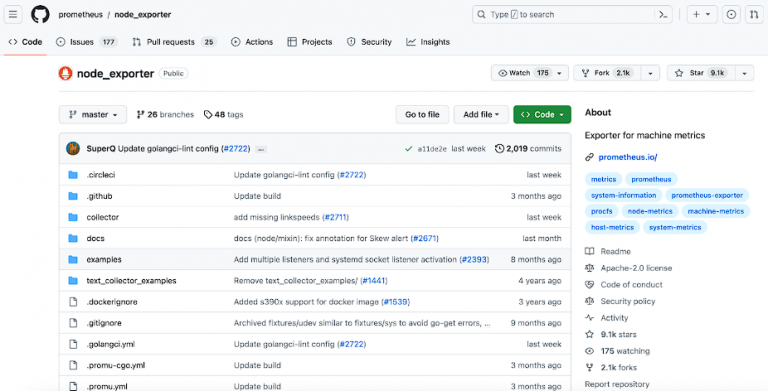
To collect metrics from containers, Prometheus relies on small programs called exporters. These exporters run alongside containerized applications and provide the necessary metrics in a format that Prometheus can understand.
For example, the Node Exporter collects metrics related to the performance of the host system, such as CPU usage, memory consumption, and network activity.
Once the metrics are collected, Prometheus offers a query language called PromQL. This language allows users to perform advanced queries and calculations on the collected metrics. With PromQL, users can extract specific metrics, calculate rates, and create custom expressions to gain insights into the system’s performance.
Prometheus also includes an alerting system that can be configured to send notifications when certain conditions or thresholds are met. This feature helps system administrators stay informed about any issues or anomalies in the system’s performance.
Resources
System administrators and developers must consider the unique characteristics and resource demands of each container running on a host. This means you really need to understand how the application behaves and what resources it needs within the container. Mismanaging container metrics can cause resource conflicts, wasted resources, and performance slowdowns.
To efficiently handle the specific needs and requirements of each container, container orchestration tools like Kubernetes can be utilized. Kubernetes simplifies the process of deploying, scaling, and managing applications that are packaged in containers. It provides helpful features like tracking and managing the allocation and usage of resources. This ensures that containers have the appropriate amount of resources available to operate at their best performance.
Network management
Containers communicate with each other through networks. Optimizing container network usage requires careful consideration of network topology, load balancing, and security. Additionally, scaling containerized applications across multiple hosts introduces challenges in ensuring consistent network connections and efficient data transfer between containers.
Container networking tools like Docker Swarm and Kubernetes provide built-in networking capabilities for containerized applications. They handle network topology, load balancing, and security aspects. In addition, tools like Istio can enhance network management by providing advanced traffic management, security, and observability features for microservices within containers.
Monitoring
Unlike traditional monitoring, where host-level metrics suffice, container monitoring requires leveraging specialized tools provided by container management platforms. You can spin up, adjust, and terminate containers on a whim. This makes containers very dynamic. However, the dynamic nature of containers makes it challenging to monitor them using traditional techniques.
Monitoring containerized applications requires visibility into individual containers, and the orchestration and scheduling of containers across a cluster of nodes. In addition, container monitoring often requires integration with external monitoring systems and observability tools to alert, detect issues, and log analysis.
Container orchestration platforms like Kubernetes often offer built-in monitoring solutions.
For example, Kubernetes has integrated monitoring with its metrics API and provides visualization and alerting capabilities. The metrics API in Kubernetes is like a central hub that:
- gathers and shares important information about how containers, nodes, and other parts of the Kubernetes system are performing
- It collects data about things like how much CPU power is being used
- how much memory is being used
- the activity happening on the network
This data gives a detailed view of how well the containerized environment is running and helps people understand its health and performance.
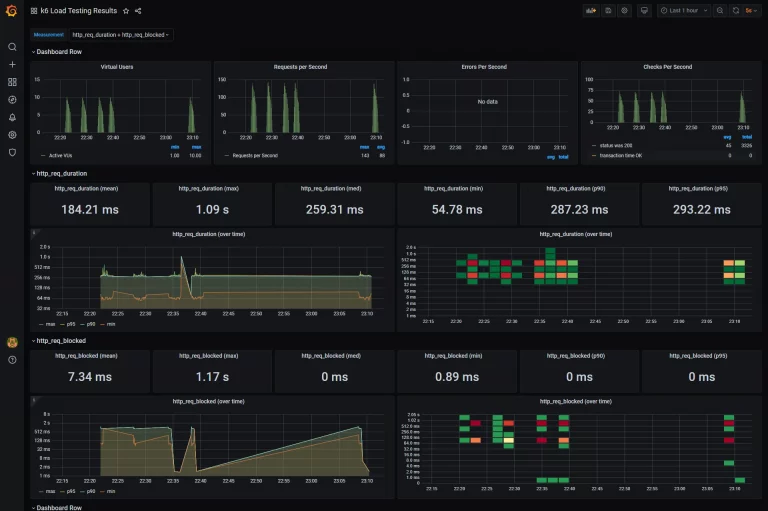
Additionally, tools like Grafana can be integrated with Prometheus to create visually appealing dashboards for monitoring container performance and resource usage. Check out the performance testing dashboard example below created by Nigel Mulholland:
Deployment
Deploying a containerized performance environment which is similar to production is another challenge because containers are so dynamic. You have to create similar workloads otherwise those two systems will scale up containers very differently. To make sure that the testing and production environments are similar, tools like Docker Compose can be really helpful. Docker Compose lets you describe multi-container applications and their dependencies using a special file called YAML. This allows you to easily set up and recreate the same environment that you have in production when you’re doing performance testing with containers.Challenges when scaling microservices
These are the main challenges when using microservices at scale:
Third-party dependance
Microservices rely heavily on external services. If these services experience downtime or become unavailable, it can affect the functionality and performance of the microservices.
- When scaling, you’re putting more pressure on third-party services because the number of network calls goes up. You may end up with slowdowns and performance issues if your third-party services can’t handle the increased load.
- Security and compliance are also important things to keep in mind. This is especially true if your system is handling sensitive or highly regulated data.
- Ensuring that all instances of microservices use compatible versions of third-party dependencies can be difficult. Version mismatches can lead to unexpected behavior or errors during scaling.
- Simply managing ALL third party dependencies is a big ordeal
When relying on external services, it’s crucial to ensure their availability and performance. Service virtualization tools like Mountebank and WireMock (both open source!) can simulate the behavior of third-party services during load testing, allowing you to test microservices’ resilience and performance in various scenarios without depending on the actual services.
Do you want to quickly mock up a Mountebank example project? Check out Mock It with Mountebank!.
Data Consistency
Microservices behave differently with different types of data. So creating correct and good quality data is really important.
To ensure the system works properly, every instance of a microservice should have access to the most recent and accurate data. In addition, it is important to use appropriate techniques and strategies for synchronizing data to ensure consistency.
This is where tools like Apache Kafka and Apache Pulsar come in. They provide special systems for sharing and synchronizing data in a reliable way. Here are some things to know about these tools:
- Apache Kafka: Kafka is a powerful platform for handling large amounts of data and messages. It allows microservices to send and receive data through streams, which are like flowing streams of events or information. Kafka makes sure that these messages are safely stored and copied across many computers in a group, so even if one microservice fails or there’s a network problem, the messages won’t be lost. Kafka can handle a lot of data and is good for systems with high volumes of messages.
- Apache Pulsar: Pulsar is another useful tool for managing data in a distributed way. It’s designed to be fast, scalable, and reliable. Pulsar uses something called topics to let microservices talk to each other. Topics are like channels or subjects where data can be sent and received. Pulsar takes care of copying the messages across multiple groups of computers to make sure they are safe and available. It also allows data to be stored in different ways, like in memory or on disk, to manage it efficiently.
Sequencing/flow
Microservices make a variety of calls. The sequence of each call in the flow needs to be accurate to:
- create real work scenarios
- determine the order in which different services interact with each other
Microservices are independent and communicate through APIs. Ensuring the correct order of API calls guarantees the utilization of accurate data and the completion of appropriate actions. This helps maintain consistency and prevents errors or conflicts that could arise from out-of-order execution. It also enables the overall system to function smoothly and reliably.
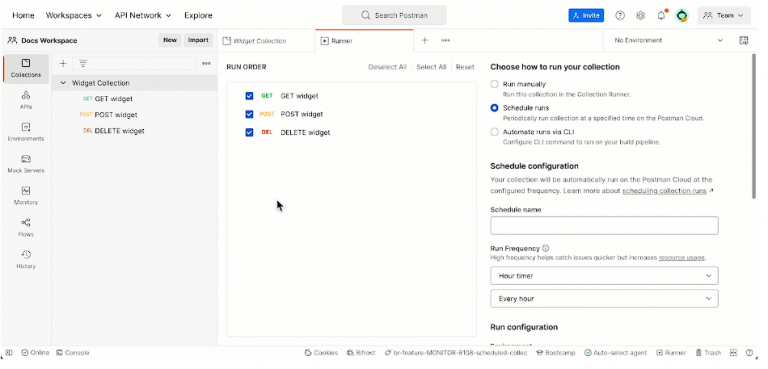
Tools like Swagger and Postman can assist in managing the sequencing and flow of API calls between microservices. Swagger helps with defining and documenting APIs, ensuring consistency in communication between microservices. On the other hand, Postman allows you to create and execute API requests in a specific order, enabling you to design and test the sequence of calls accurately. In the example below, see how API calls are easily dragged up or down in the RUN ORDER section.
Getting Started with TPC
- make the performance better
- make sure the system can handle the expected amount of activity without any problems


0 Comments